Measure Rendering Performance and FPS
Chrome provides a frame rate timeline enabling the ability to debug a site on a frame by frame basis.
To create a Frames timeline, first open the Chrome Developer Tools and select the "Timeline" tab. At the bottom of the tab are a number of icons including a black circle which represents 'record'. Press this once to enable recording of the timeline and a second time to stop the recording. Whilst recording, you can interact with the page in the usual manner and Frames mode will record all the frames of action.
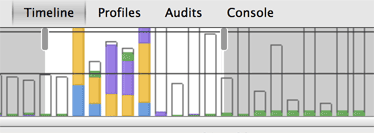
Each bar along the timeline graph represents a single frame of animation, and are coloured as follows: blue for loading tasks, yellow for scripting tasks, purple for rendering tasks and green for painting tasks. The white area represents idle time.

Below the timeline graph is a waterfall diagram of how the page performed. Frames are shown in the header columns, with the number of milliseconds it took to draw the frame in the header cell; while records of the actions taken are shown down the left side.
You can drag the two grey mouse sliders to change the number of frames of the timeline you wish to inspect.
Hovering the header rows on the timeline reveals the duration of the frame; the FPS count; the CPU time and the aggregated time of actions within the frame.
Hovering over records on the left, you can see a breakdown of the duration of each task; together with other useful information. The part of the page should also be highlighted, if relevant. Some tasks are grouped and can be inspected by clicking the arrow within the waterfall diagram.